A large
consideration of developing trading systems should be how efficient our
capital is working for us. The quicker we can realize profits, the more
trades we can make thus allowing our capital to compound more quickly.
Additionally, sitting in positions for long periods increases our risk
to extraneous events.
More
importantly, it is typically easier to find daily or higher timeframe
edges than intraday edges due to the increased noise in intraday data.
Is there a way
to reduce the time in a position which would increase our trade count
(via number of strategies) which would then allow us to arrive at the
law of large numbers more quickly and therefore allow our capital to
compound more quickly?
Yep. One of the new features in Build Alpha,
called “Intraday Edge”, is a tool which allows us to do exactly that.
It allows us to dig deeper into daily trading strategies to see if we
can make them more efficient by reducing their holding times into
smaller intraday time windows. Maybe we can capture most of the daily strategy’s edge during only a small portion of the typical holding time. That’s right.. turning daily strategies into intraday strategies.
A simple example can help clarify the power of this new feature…
First, let’s
take an original daily trading system. I will use a simple one rule
strategy that goes long the SP500 futures contract whenever the trading
session closes in the bottom 20% of the day’s range (internal bar
strength or internal bar rank – IBR in Build Alpha). We then hold that
long position for 1 day. This assumes about a 23 hour risk (i.e., one
Globex trading session).
However, what
if we could dig into this strategy and realize that most of the gains
only come from 1 am EST to 4 am EST? We can then reduce our holding time
by about 87% which now only ties up our capital for 3 hours as opposed
to 23! This gives us an additional 20 hours to utilize other strategies
to continue to grow our capital while still capturing a large portion of
the original daily strategy’s edge.
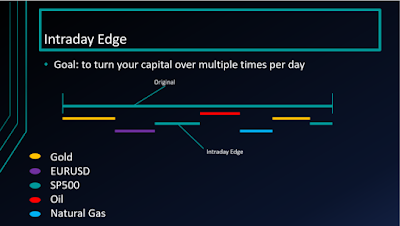
Imagine we
only had enough capital for one strategy. This Intraday Edge feature can
now make our capital work much harder by finding intraday edge
strategies for multiple markets/times of the day. Tying up capital for
23 hours in one daily strategy vs. trading 7 different intraday edge
strategies with the same capital.

*Original strategy can be
reduced by Intraday Edge which allows other intraday strategies to be
traded with the same capital that was orignially tied up by the daily
strategy*
In the end, it makes our once daily
system much more efficient. Check out the performance metrics of the
original daily system compared to the new “Intraday Edge” version.
- Highlight any daily strategy
- Click the Test Settings in the bottom right to configure the intraday timeframe you want to use
- Hit the Intraday Edge button
BuildAlpha
will then search all possible holding periods within the original
strategy’s trading duration to see if there is a more efficient version
with reduced holding times. You can include the original strategy’s exit
criteria such as stops, etc. or choose to exclude them. Flexibility to
test everything is always key in Build Alpha.
Intraday Edge can even be used on
different markets at the same time. For example, imagine an original
system built on Gold daily bars but then we search for an intraday edge
version that trades oil but only during this specific 2 hour window
while the original Gold System has an active signal.
This Intraday Edge feature essentially
allows us to search for intraday and multi-timeframe strategies in a new
way. In this above Gold and Oil example we have a multi-timeframe AND
intermarket strategy created from a simple Gold daily strategy.
You can still search for multi-timeframe
and intraday strategies in the original/traditional way. That is, just
searching the intraday data from the start. However, it is often faster
and easier to find daily strategies then work them into intraday ones.
At least now with Build Alpha you have the option to search both ways. Something not possible elsewhere.
And of course, all of the adjustments
from the Intraday Edge feature are then applied to the code generators
so you can automate these Intraday Edge systems with one click as with
everything.
As always, I will keep attempting to add
flexibility and ways to dig deeper so we can have the best trading
strategies possible. Leave no stone unturned and test everything!
Thanks for reading,
David


