
Build Alpha: Basic video explaining and testing Moving Average Convergence Divergence (MACD) on some popular Exchange Traded Funds (ETFs) such as: SPY, QQQ, TLT, GLD and more.
Wednesday, 2 September 2020
Tuesday, 2 June 2020
Intraday Edge: Find strategies backwards
A large
consideration of developing trading systems should be how efficient our
capital is working for us. The quicker we can realize profits, the more
trades we can make thus allowing our capital to compound more quickly.
Additionally, sitting in positions for long periods increases our risk
to extraneous events.
More
importantly, it is typically easier to find daily or higher timeframe
edges than intraday edges due to the increased noise in intraday data.
Is there a way
to reduce the time in a position which would increase our trade count
(via number of strategies) which would then allow us to arrive at the
law of large numbers more quickly and therefore allow our capital to
compound more quickly?
Yep. One of the new features in Build Alpha,
called “Intraday Edge”, is a tool which allows us to do exactly that.
It allows us to dig deeper into daily trading strategies to see if we
can make them more efficient by reducing their holding times into
smaller intraday time windows. Maybe we can capture most of the daily strategy’s edge during only a small portion of the typical holding time. That’s right.. turning daily strategies into intraday strategies.
A simple example can help clarify the power of this new feature…
First, let’s
take an original daily trading system. I will use a simple one rule
strategy that goes long the SP500 futures contract whenever the trading
session closes in the bottom 20% of the day’s range (internal bar
strength or internal bar rank – IBR in Build Alpha). We then hold that
long position for 1 day. This assumes about a 23 hour risk (i.e., one
Globex trading session).
However, what
if we could dig into this strategy and realize that most of the gains
only come from 1 am EST to 4 am EST? We can then reduce our holding time
by about 87% which now only ties up our capital for 3 hours as opposed
to 23! This gives us an additional 20 hours to utilize other strategies
to continue to grow our capital while still capturing a large portion of
the original daily strategy’s edge.
Imagine we
only had enough capital for one strategy. This Intraday Edge feature can
now make our capital work much harder by finding intraday edge
strategies for multiple markets/times of the day. Tying up capital for
23 hours in one daily strategy vs. trading 7 different intraday edge
strategies with the same capital.
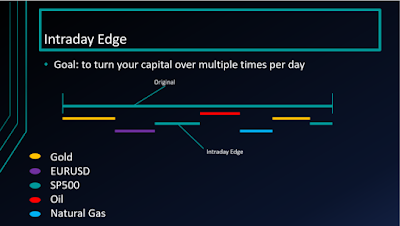
*Original strategy can be
reduced by Intraday Edge which allows other intraday strategies to be
traded with the same capital that was orignially tied up by the daily
strategy*
In the end, it makes our once daily
system much more efficient. Check out the performance metrics of the
original daily system compared to the new “Intraday Edge” version.

- Highlight any daily strategy
- Click the Test Settings in the bottom right to configure the intraday timeframe you want to use
- Hit the Intraday Edge button
BuildAlpha
will then search all possible holding periods within the original
strategy’s trading duration to see if there is a more efficient version
with reduced holding times. You can include the original strategy’s exit
criteria such as stops, etc. or choose to exclude them. Flexibility to
test everything is always key in Build Alpha.
Intraday Edge can even be used on
different markets at the same time. For example, imagine an original
system built on Gold daily bars but then we search for an intraday edge
version that trades oil but only during this specific 2 hour window
while the original Gold System has an active signal.
This Intraday Edge feature essentially
allows us to search for intraday and multi-timeframe strategies in a new
way. In this above Gold and Oil example we have a multi-timeframe AND
intermarket strategy created from a simple Gold daily strategy.
You can still search for multi-timeframe
and intraday strategies in the original/traditional way. That is, just
searching the intraday data from the start. However, it is often faster
and easier to find daily strategies then work them into intraday ones.
At least now with Build Alpha you have the option to search both ways. Something not possible elsewhere.
And of course, all of the adjustments
from the Intraday Edge feature are then applied to the code generators
so you can automate these Intraday Edge systems with one click as with
everything.
As always, I will keep attempting to add
flexibility and ways to dig deeper so we can have the best trading
strategies possible. Leave no stone unturned and test everything!
Thanks for reading,
David
Noise Test Parameter Optimization
In short, this
is a new feature that allows us to optimize strategies across noise
adjusted data series as opposed to the traditional method of
optimization which only optimizes across the single historical price
series.
The problem we face is the historical data is merely only one possible path of what *could* have happened. We need to prepare ourselves for the probable future not the certain past. In
order to do this, we can generate synthetic price series that have
altered amounts of noise/volatility than the actual historical data.
This provides us with a rough sample of some alternate realities and
potentially what can happen going forward. This is the exact type of
data that can help us build more robust strategies that can succeed
across whatever the market throws at us – which is our end goal in all
of this, right?
Let’s look at a Noise Test Parameter Optimization (NTO) case study to show exactly how it works…
I have built a strategy from 2004 to 2016 that does quite well. The strategy’s performance over this period is shown below…
Now, if we
right click on the strategy and select optimize, we can generate a
sensitivity graph that shows how our strategy performs as we alter some
parameters. This is done on the original historical price data with no
noise adjusted data sample added (yet). We simply retrade different
variations of parameter settings on the single historical price data and
plot the respective performances. This is how most platforms allow you
to optimize parameters and I want to show how misleading it can be to
traders. The rule I’ve optimized had original parameter values of X = 9
and Y = 4 (black arrow). The sensitivity graph is shown below. Each plot
consists of three points: parameter 1, parameter 2 and the resulting
profit.

Build Alpha:
We can see the original parameters are near a sensitive area on the
surface where performance degrades in the surrounding areas. Performance
drops pretty hard near our original strategy’s parameters which means
slight alterations to the future price data’s characteristics can
degrade our strategy’s performance quite a bit. Not what we want at all
and, as we all know, there will be alterations to future price’s
characteristics! How many times has a backtest not matched live results?
Perhaps more robust parameter selection can help
The more
robust selection using the typical simple optimization method on the
historical data shows we should probably pick a parameter more near X = 8
and Y = 8 (pictured arrow below). This is the traditional method taught
in textbooks, trading blogs, etc. We optimize on the single historical
data then find a flat/non-peaked area close to our original parameters
and use those new parameters.
However, if we run BuildAlpha’s
Noise Test Optimization with up to 50% noise alterations and 50 data
samples (green box below), we see a much different picture. What this
does is, instead of optimizing on one historical path we now optimize
across the one historical path AND 50 noise altered data series. The
sensitivity graph shows a much different picture when optimized across
the 51 data series. We are less concerned with the total profit and loss
but rather the shape of the surface…
Originally Posted: http://buildalpha.com/noise-test-parameter-optimization
Originally Posted: http://buildalpha.com/noise-test-parameter-optimization
Friday, 15 May 2020
Make Task Investing Easy
Investment in
stocks in such a volatile market nowadays has become a cause of concern
and how to manage one’s finances. Most of the people ask their fund
managers to invest in quality stocks at this point in time. Which is the
best asset class to invest in and how to manage your portfolio? Some
people think that investment is the most straightforward aspect of
financial planning, whereas nobody knows the correct answer and is
debatable. But now, with the advancement of technology, things have
become quite more comfortable and if we look at the broader pictures
with investing tools like Build Alpha, it is far easier to invest and trade with the best expertise available with you at every point of time.
Investment in
the capital markets can be comparatively easier than other asset classes
or yield drivers. One should invest smartly and systematically keeping
in view the returns on your investment, but most of the investors do it
otherwise, and everything is turned around like not placing the
upside-down cake correctly, thus the toppings at the bottom scatters.
With a tool like Build Alpha now investing activity has become way
easier as it gives proper analysis of the trend of the market.
Especially for
the new age investors who have just entered the market, they can
quickly get the knowledge in the simplified version through this unique
tool. It is very user friendly and an easy to access tool that serves
just perfect for solving the queries and dilemmas of new as well the
experienced traders and investors. Even if you are dealing in the market
for long-term, there ought to be something or the other that may bother
you or you may not understand as the market is quite volatile and it is
quite difficult to depict the pattern well.
Here is where BuildAlpha
comes into play by helping you out with that uncertain motions of the
market where you fear to take your next steps. As with unpredicted
levels and economic uncertainty of course comes a lot of risks. Build
Alpha can help you identify these risks to hopefully sidestep them
before they affect your portfolio.

Very well
written by Warren Buffet, there are lots of ups and downs in the stock
market, and one should be patient. That is why he termed the capital
market where investing is a no-called-strike game. So now, with this
unique and very useful tool, it has become much simpler to invest in the
capital markets and earn money, and the same time the fear of losing
will be minimized as now you have experienced moves, tested them and are
ready for the next one. Therefore, do the research of the markets with
the help of Build Alpha before you are interested in investing and before new risks hit the market.
Originally Posted: http://buildalpha.us/make-task-investing-easy/
Friday, 8 May 2020
Volatility Filters Into Stock Market Decline
The recent volatility, like all volatility events, has brought some traders a fortune and others pain.
The ability to identify volatility regimes is paramount!
Correct
identification of volatility shifts gives one the ability to adjust
size, turn strategies off, enable hedging strategies, etc.
Ideally, a
trader should have strategies for every market regime. If one can
identify which regime and price action characteristics are likely (or
unlikely) then plenty of stress can be removed and a certain level of
robustness is added to the trader’s portfolio.
In this post, I
want to discuss four ‘volatility identifiers’ that can hopefully be
used to either avoid or capitalize on the next volatility event.
These have been powerful indicators to add to trading systems to help decide when on/off, filtering and of course sizing.
Are they a be all end all? No.
Are they predictive? No.
Are they a holy grail? No.
Should you ignore them? No!
I will only
examine these volatility regimes based upon tomorrow’s range and
tomorrow’s return.
They can of course be expanded to look at 5 days
forward, 20 days forward, etc. but this is left up to the reader.
Plotted below
is how these volatility identifiers affect the S&P 500’s next day
range and return. The X-axis is the volatility identifier and the Y Axis
is the S&P 500 range (or return) for the next day.
BuildAlpha:
In short, the level of these volatility identifiers has a BIG impact on
what you can expect for tomorrow’s session and thus your trading
systems can/should take a look to see if these can help improve
performance or even alert to when some strategies should be ‘offline’!
1)
Treasury Spreads vs. S&P 500 Futures. When the 10-year yield minus
the 2-year yield is too flat or too steep things tend to get
volatile. The x-axis is the basis points of this spread. This is the
only goldilocks identifier in this post where volatility increases at
both extremes of this indicator but mellows out in the middle of the
range.
2)
Whenever the front month VIX futures contract is trading above the
second nearest month by more than 5-10% things tend to get volatile.
Here is the VIX futures curve in March of 2019 vs. March 2020 as well as
the contango percent.

3)
Whenever SPX index’s option gamma exposure (GEX) is negative things
tend to be more volatile. Gamma exposure is the total sum of gamma
(option greek) multiplied by open interest of the calls minus the sum of
gamma multiplied by the open interest of the puts. This gives us a
sense of where/how option market makers are positioned. When GEX is
negative things tend to get volatile.
4)
Whenever the S&P 500 components’ gamma exposure is negative things
tend to be more volatile as well. Obviously very correlated to #3 but
important to note the distinction. This is like above but is the
aggregate of the actual options on the ~500 stocks in the index vs. the
options on the index itself.

There are
other volatility identifiers such as Dark Pool Index (DIX), counting the
number of S&P 500 stocks above/below the 50 day moving average,
number of new highs vs. new lows, economic data filters, etc.
Also, to be fair, Gamma Exposure and Dark Pool Index were first published here: https://squeezemetrics.com/download/white_paper.pdf and pointed out to me by a bunch of Build Alpha users. I want to give credit to where it is due.
In the latest Build Alpha update
all of these volatility identifiers, economic data and market breadth
filters will be included and testable at the click of a button. Even
possible to automate them as part of your strategies built and/or
improved by Build Alpha.
I am looking forward to a post COVID world
and what the market will bring us on the other side. Be prepared! Any
questions please contact me at david@buildalpha.com
Tuesday, 5 May 2020
Build Alpha Update
Build Alpha: In the latest update it is now easier than ever to modify the built-in signals, optimize parameters across noise adjusted data series and other symbols, create rebalance strategies, search for intraday edges and new signals including Gamma Exposure, Dark Pool Index and more.
Tuesday, 7 April 2020
Ideal Investing Tool
Trading and Investing is not an easy job and it is
best if you have an expert’s advice or better yet a true quantified
edge. To gather expert advice and quantified edge, there is a unique
tool on the market which is designed specifically for trading and
investing purposes. It will serve the purpose for the new investors, and
for the existing ones who are experienced in providing them with expert
advice, new methods of testing and validation. Build Alpha is the ideal software that will help you creating a trading or investing plan that experts would be proud of.
With this best investing tool, you inevitably live in
the golden age of stock market investing. You will get unlimited
information, which everyone can reach who is using the software. Build
Alpha provides unparalleled data, signals and testing methods to help
you build the best trading or investing strategies. It is such a unique
tool which will help you in many ways.

It is very economical and is of great tool which
small investors are taking great advantage of. These small investors
spend next to nothing for tools, the best investing tools, and
knowledge. If you’re someone who is invested in the stock market, you
should surely look at BuildAlpha. It can even help you analyze your existing trading or investing strategies as well as help you create new ones.
Features of Build Alpha Investing Tool
1. The first advantage that you get from this tool, Build Alpha
is the ability to test thousands of trading and investment signals
without having to write any code yourself. You can select from
candlestick patterns, technical indicators, volume, market breadth
studies, intermarket signals, multi-timeframe signals and much more to
test, create and build your perfect investment strategy – all is done
point and click with no programming. This gives the trader and investor a
significant advantage because of the amount of time saved.
2. Free Portfolio Analysis – Another
feature that you should check for is the portfolio analysis or
Portfolio Mode. With the help of Build Alpha, all the aspiring investors
can analyze their portfolios for prospect and opportunity. This
portfolio analysis tool will not cost a lot of money and will give you a
lot of investing tools and tests you can use. It will offer you
tremendous robust analysis tools. These tools possess a piece of expert
advice which actually feels like it contains various experts. The tools
also allow you to run simulations, find efficient quantitative test and
factor-based financing models.
Individual stock investors can use this software for
to find the best portfolio for their risk return desires. Investors can
track trades, calculate risk-adjusted revenues, and conduct quantitative
research. It will also assist you in maintaining your portfolio as a
whole rather than just your individual strategies and positions.
3. Education of Investors
To compete in today’s market, traders and investors
need proper tools and education. Build Alpha comes complete with private
training video course to assist new and advanced traders and investors
on how to properly build strategies, test them and construct proper
portfolios for individual risk/reward characteristics. This is an all in
one tool that comes complete with training. This gives Build Alpha users significant advantage over their counterparts still attempting to learn and build strategies manually.
Originally Posted: http://buildalpha.us/ideal-investing-tool/
Thursday, 5 March 2020
Insights of Trading
Trading is not as easy as we think it
is, it requires years of experience or proper expert advice. Most of us
do not have years we can sacrifice to learn the markets and all that is
required to be successful. In that case, it is necessary to find some
expert advice or something equivalent to expert advice to assist in your
decision making. This is especially true for investors who are
investing in the market for the very first time. They need to step in
the stock market with prudence and care as they are new traders with
limited knowledge competing against some of the top sharks in the world.
On the flip side, there are so many experts that it is hard to know
which expert to trust and listen to as half of them are right and half
of them might not really be experts at all.
To replace this confusion and need for an external investor, new software like Build Alpha
can help. This software makes trading and investing about the data and
finding the right data to support your investment ideas. If the data
does not agree with your idea, then you should not act. One thing which
should be in your mind while investing is to avoid greed and do not have
fear while investing. Make a portfolio from various sectors, asset
classes and countries. Researching your own data and constructing your
own portfolio using powerful software like Build Alpha is proving to be
the most trustworthy resolution in today’s complicated markets.

Talking about potential new investors,
they are always in for those assets which have moderate valuations or
big risk and reward characteristics. Different market analysts have
their investment strategies owing to the Bull and Bear phase of the
market. There are many loopholes for the ones who are trading for the
first time in the market. This is a beginning as well as continuous
guidance to explore, learn and succeed in the trading market.
There is no one that can independently
know all the things in the market as it is a very vast dynamic area, but
with the aid of human-made knowledge and powerful software like BuildAlpha,
one can lead the scale of success as they have the guidance of more
than one expert. You will discover a lot of innovative things about
trading. The tool is an overall solution to guide you on the right track
in the trading. To seek the answers in which you need and can trust.
So why are these trading tools becoming so important?
The first aspect is in the fact that
these trading tools are the simplest way to conduct proper research and
test ideas to compete with professional investors and hedge funds. Build
Alpha works on any market cycle, interest rate environment,
inflationary or deflationary economy and market trends or chop. It is
important to devise a trading plan for all the different scenarios and
having a tool that can test for this is paramount to both individual and
professional success. Now we have just evened the playing field.
Next up is the need for diversification,
which requires in-depth studies of correlations, different markets and
how they interact. How will you construct a portfolio of diverse assets
and strategies? Do you have a means for testing this portfolio in the
different market cycles? This is the void Build Alpha
can fill in your process to lead you to your desired result. Please do
not trade or invest without data and proper testing, especially now that
it is so easily possible!
Originally Posted: http://buildalpha.us/insights-of-trading/
Monday, 17 February 2020
Why Are Expert Analysis Tool Vital In Stock Market ?
One should invest in the right manner to
get the appropriate return nowadays. A lot of hard work is put in to
earn and in achieving your goals, which may not be sufficient for
leading a comfortable lifestyle. In order to fulfill your dreams, the
investment should be made appropriately to make your money work hard.
Money lying in your bank is not earning anything, so you must trade or
invest your money smartly to earn a return.
Investing in an equity market, one must
have the proper knowledge of its technical as well as fundamental
analysis. Both technical and fundamental analysis will tell you some
about the movement of different stocks but how can you be sure?
Quantitative analysis can be the missing piece. That is, using
historical data and statistics to find the best opportunities.
This enables you to better decide on entering and exiting from the market. BuildAlpha
is devised to help in making your investment decisions. Technical
analysts tell you the movement of the prices of the various stocks and
seemingly guess when to buy or sell a stock. But it is not always
possible to take the support of human “experts” all day long, but now
with the help of this analytical software, it has become possible. The
software does not comprise a single expert knowledge but knowledge of
various experts (that is, the historical data).

Types of Analysis by Software
Software, like Build Alpha,
are best suited to serve the quantitative analysis, stock screening,
and thereby provide the right base to start strong in the market,
especially for someone new to the market. Once the investor sets a
tracking portfolio of corporations (or commodities or forex), then the
analysis tools become valuable. Once the investor has created the group,
portfolio tools will present all the right techniques to achieve these
funds efficiently, thereby helping you succeed in the complex stock
market easily as the analysis tool helps in drawing out expert
assumptions by drawing in various price patterns. Also, for technical
analysis, they offer an excellent and interactive charting platform for
clearing up your queries. An investor can quickly get to know about
which indicators and moving averages work best on a particular market
and can customize these to meet their desired plan.
Primary Functioning Of the Expert Tools
The primary function of Build Alpha
is to allow the trader and investor the ability to find what price
patterns, fundamental analysis and indicators work best in providing the
best risk return. There are many advanced statistical tests like Monte
Carlo simulations and noise testing that help the trader and investor
decide if an investment strategy is robust and will likely show similar
returns moving forward. This is the key to any solid investment strategy
– not how it has done historically but how we expect it to perform
going forward. Without being able to determine this then one is destined
for failure.
Originally Posted: http://buildalpha.us/expert-analysis-tool-vital-stock-market/
Monday, 3 February 2020
What is need for Trading Software?
Trading is one of the most popular
activities in which people are doing these days to earn money, start a
new career or even just supplement their income. Some even consider
trading and investing a passive source of income – which of course
requires some knowledge of the market. For someone who has already been
trading and trying their luck, it can still be better to keep pushing
forward without help. But for someone new to the trading market or the
struggling trader, that person surely needs additional help to trade the
right way.
Finally, there is a software to assist. A tool like a Build Alpha
can help them facilitate trading ideas and better understand the
financial outcomes, such as risk and reward, drawdown, position-sizing,
etc. It can also be used on any market type such as futures, stocks,
currencies, bonds and even cryptocurrencies. Dealing in all these
markets as a primary market or secondary market is made easier with the
help of software. Comparing the same with the other options like taking
the help of gurus or trading ‘experts’ leads to massive misinformation,
account loss, and brokerage cost. These firms and ‘educators’ present
their buyers with buying ideas that have not been tested or on the
behalf of other clients that want to take the other side.
Software like Build Alpha
that helps in trading is quite accessible as it can be easily
downloaded and launched from a desktop or portable device. There is no
skill required to operate it as the software can take any user input and
return satisfactory results for trading and investing decision making.

So Why are these trading tools Vital
Let’s see the following essential points of these trading tools:Trading software helps in facilitating buying and examination of financial outcomes.
It helps the traders that are trading
alone, which is the self-directed trader. They require to employ and
discover how to efficiently manage their trading software in enhancement
to learning how to buy or invest.
Many other General characteristics of these
trading tools incorporate order arrangement, technical review,
structural analysis, electronic trading, and journal trading. So there
is a lot on your plate that is served with this single tool.
Comprehension of This Trading Tool
These trading tools like BuildAlpha
are giving the right set of insight to the traders to deal in the
security market. Many of the traders and investors these days have
shifted towards making at least some of the trading and interpretation
utilizing the self-directed trading accounts. This is the main reason
that there is an increase in the demand for such software that will
provide the right trading capabilities — also giving a thorough analysis
and knowledge resources within the software.
This software can give users the right
pricing information for assets, fundamental data, graphs, functional
analysis, vital statistics, some basic chat rooms, and many other
features that are vital from the investment point of view. You will get
the best application programming interfaces, that help service the trading software management. So now you can run independently on their network.
Thursday, 30 January 2020
Improving Strategies
A crazy cool way to use Build Alpha. I have to admit that I did not come up with this idea, but it was suggested to me by a potential Build Alpha user.
He was wondering if Build Alpha could
help come up with some rules of when he should avoid trading his
existing strategy or even when to fade his existing strategy. Heck any
improvement is a plus, right?
**Please note Build Alpha now
accepts data in this format: mm/dd/yyyy, hh:mm, open, high, low, close,
volume, OI. Please refer to buildalpha.com/demo page for adding own
data instructions**
*I say we found one strategy but we
actually found tons that would be an improvement to his original
strategy. Him and I only spoke specifically about one so that’s why in
the video I slip and say we found one strategy. Did not feel like making
a new video to clarify this minor point.*
He had a day trading system and compiled
profit and loss results for that system in the following (Build Alpha
accepted) format. Date, time, open, high, low, close, volume. (*note BuildAlpha now accepts the time column as intraday capabilities are becoming fully operational*).
Below is his sample file. We purposely
left the open (high and low) columns as all 0’s. The close column
contains the end of day p&l from his original strategy.
We then set Build Alpha to have a
maximum one bar holding period and to ONLY enter on the next bar’s open
and to the ONLY exit on the next bar’s close. I will explain why this is
in a minute.
We then chose the underlying symbol the
original strategy was built on as market2. So for example, his original
strategy trades ES (S&P500 Emini futures) so we only select Build
Alpha signals calculated on Market2 which is set for ES.
So now if Build Alpha
calculates a rule on ES-like close[0] <= square root(high[0] *
low[0]) then we would “buy” the next bar’s open of market1 (again his
results – which are 0) and “sell” the next bar’s close of his results
which is the original strategy’s p&l for that day. This would
essentially say that if this rule is true then go ahead with a green
light to trade the original strategy the next day. If the rules are not
true, then don’t trade the original strategy the next day. Ideally, we
can find rules that increase risk-adjusted returns for the original
strategy (which we did).
Now, what is even cooler is if we set Build
Alpha to find short strategies we would essentially be “fading” his
original strategy or finding rules of when to go opposite his original
strategy.
Build Alpha found some good short/
“fade” rules to use as well. Here is an example that did quite well
fading his original strategy (even out of sample – highlighted section).

“There are 2028 negative
periods in my data with a gross loss of -1,217,880.26. That’s the
theoretical maximum a short rule can achieve, if it were to find all
losses. Your graph seems to show 380,000 short rule profits. That’s
already 31% of all losses. If I don’t trade on these days, my net profit
would go up by 380,000, a 46% increase.”
I thought this was a really unique way to use BuildAlpha
and I wanted to share. I think the same analysis can be done on
strategies with longer holding periods too. I would just import daily
marked to market results of the original strategy and Build Alpha would
essentially find rules of when to hedge your strategy or fade it for a
day or two. I think this is certainly a unique approach to add some
alpha to performance.
Anyways, thanks for reading as always and keep a lookout for some MAJOR upgrades coming to Build Alpha very soon!
Originally Posted: http://buildalpha.us/improving-strategies/
Thursday, 23 January 2020
Perks Of Using Trading Software
Stock trading has become a significant
market segment. Every third person is dealing with the same trend. This
segment of the market serves a great set of the potential to make a lot
of money. There are instances where you will observe some of the
wealthiest persons in society have made their estates in stock markets
and investments; they have earned tremendously from this asset class.
However, most do not have a financial
background or business degrees. It is not just their own expertise that
has led them to such success in the market, but it is the assistance of
trading and investment software. Software like Build Alpha
can help guide traders and investors through tricky markets and
identify the biggest trends that lead to wealth accumulation and a
better understanding of the market.

This software Build Alpha,
helps them gain an entire overview. Beginners will be guided on the
underlying trend of the market as well as advanced traders and investors
who can find specific trends for stocks of interest. There are several
thousands of people who are contemplating to make money in the stock
market by analyzing a mixture of approaches. There are also,
unfortunately, many business organizations that create lies, false
narratives and sell misinformed ‘courses’ to naïve investors. Build
Alpha software allows the investor to research the data himself and only
trust the numbers, not some lie a business is selling.
This is the primary cause that stock
trading software has become so popular with investors as the software
can allow investors to execute their trading strategy quickly, based on
facts and systematically. There are several goods of utilizing an
automated trading system or stock investing software to make money in
the stock exchange.
Originally Posted: http://buildalpha.us/perks-of-using-trading-software/
Sunday, 19 January 2020
Forward Simulator and Variance Testing
Build Alpha allows users to simulate how a strategy would perform in the next x trades based on varying win percentages. It uses the back test's distribution to simulate future performance.

Thursday, 2 January 2020
E-Ratio
Edge Ratio or E-Ratio measures how
much a trade goes in your favor vs. how much a trade goes against you.
The x-axis is the number of bars since the trading signal. A higher
y-value signifies more “edge” at that step in time.
BuildAlpha:
Measurements are normalized for volatility; this allows us to use
e-ratio across all markets and regimes. Once normalized for volatility, 1
signifies that we have equal amounts of favorable movement compared to
adverse movement.

In other words, the y-axis is an
expression of how many units of volatility more or against you your
trade gets. A measure of 1.2 would indicate .2 units more of favorable
volatility and a measure of 0.8 would indicate .2 units more of adverse
movement.
Build Alpha:
The blue line is for the selected strategy’s signal and the red line is
for a “random” strategy for the same market. The red line is to serve
as a baseline to beat. Ideally, you’ll want to see a blue line above 1
and above the random line.
Additionally, if E-Ratio falls off a cliff at bar 6… then it probably does not make sense to hold for 15 bars!
Another tool to make sure Build Alpha + Trader = Success.
How to calculate:
- Record Maximum Adverse Excursion and Maximum Favorable Excursion at each time step since signal.
- Normalize MAE and MFE for volatility. To compare across markets we need a common denominator. Let’s use ATR or a unit of volatility.
- Average all MFE and MAE values. Now you should have average MFE and average MAE at 1 bar since signal. Average MFE and average MAE at 2 bars since signal…
- Divide Average MFE by Average MAE at each time step.
Friday, 20 December 2019
Features of Good Stock Market Investing Tools
Investment is putting money into some
plan which an investor believes will generate more money or a nice
return on his/her investment. There are different investment instruments
also known as financing instruments used for getting loan by pledging
them for e.g. share certificate or a promissory note. Various tools
which helps you to achieve your financial goals like investing in the
equity market or in different bank products are termed as investing
tools.
There are different types of trading
apps and tools that are available online which helps the investors in
getting good result in the market. One such tool is Build Alpha
which is helping the industry expert as well as the people who are new
to the idea of investing. Build Alpha allows the investor to search for
investing strategies across any asset class, analyze risk and reward
historically and make estimates of what to expect going forward with
advanced (but easy to use) statistical methods.

What to Look for in a Trading Software?
There are many big and small things that
you need to look for in trading software before buying it. Few of
the essential features you need to look for when you decide as to which
stock analysis tools you want to use. BuildAlpha has all the under mentioned qualities you need to get in your trading software to achieve success in life.
Accurate Test Results
The most essential feature that a trader
and investor should look for in software is the accurate analysis of
investment and trading strategies. This enables the investor to make the
best possible decisions on the most reliable data before risking any
hard-earned money in the live markets.
Customizable tools
Another is the need for software which
you can customize according to your need. Every trader is different and
therefore have different needs and trading patterns. As trading plans
vary so drastically, it’s probable to interview different traders and
get completely contradictory answers when examined what makes a good
research tool. So here is where Build Alpha comes into the scene and
help traders who operate on all time horizons, asset classes and markets
across the world.
An easy format of the tool
Traders and investors can be most productive if they can easily use the tool. Build Alpha
has an intuitive design and layout that offers the most productivity to
the investor. The best research tool is worthless if it’s too difficult
to work and use. Aim for maximum productivity to ideally achieve
maximum returns!
Originally Posted: http://buildalpha.org/features-good-stock-market-investing-tools/
Wednesday, 27 November 2019
Strategy Validation with Dave Bergstrom
With the toolsets we have available to us today it’s really quite easy to create a trading strategy by just mining market data.
Build Alpha: As
we’ve just heard in that opening bit of audio and also from previous
podcast guests too, if you try enough combinations you can find
something that appears to work purely by chance or by luck.
The challenge however is trying to identify something that could be sustainable.
Something that may persist long enough in the future for us to take advantage of, and hopefully make some money from.
Our guest for this episode, Dave Bergstrom from BuildAlpha,
has spent years researching, building, testing, and implementing market
making and trading strategies for a high frequency trading firm, CTAs,
money managers, individual clients, and even aspiring retail traders.

In this episode Dave is going to share some of his insights into strategy development and validation, including:
- How adjusting the ratio of in-sample/out-of-sample data can lead to creating different types of strategies
- Variance testing – what is it and how can it be used in the strategy creation process
- How E-ratios can be used to determine how an edge decays over time & weed out potentially poor strategies with good backtest results
- Why volume and volatility are important factors to consider when building trading strategies
- Loads of other ideas to test and validate the robustness of trading strategies.
Originally Posted: http://bettersystemtrader.com/079-strategy-validation-dave-bergstrom/
Tuesday, 19 November 2019
Greatest Traders of All Time
As a
quantitative trader, I could not have been more excited for the new
book “The Man Who Solved the Markets” by Gregory Zuckerman which details
Jim Simons incredible story.
Jim Simons
averaged a 66% return over the past 30 years and a 39% return after his
5% management and 44% performance fee (pg 316 of book).
I plowed through the book and had, what I believe, are some major takeaways to share:
1. Edge is important; not the story of why it exists.
In other words, data mining is ok.
This is something I’ve long defended since the launch of Build Alpha.
You do not need a hypothesis or explanation of why a certain
investing/trading edge exists if it is statistically relevant or
significant.

In my opinion,
it is possible we simply cannot comprehend why a pattern or edge exists
because it exists in a dimension too complex for our current
understanding. Therefore, we should not discard edges that we do not
understand.
This is why I (and BuildAlpha)
search the market for edges and let the data tell us where the edge is.
Remove the human bias, false ‘truths‘ and the need to explain/justify
everything with a hypothesis or reason why it is happening. Many of
these patterns are ‘overlooked’ because they don’t have an explanation,
but have clearly been profitable for Renaissance!
Here are a few quotes to drive home takeaway #1:
“Simons and
his researchers didn’t believe in spending much time proposing and
testing their own intuitive trade ideas. They let the data point them to
the anomalies signaling opportunity. They also didn’t think it made
sense to worry about why these phenomena existed. All that mattered was
that they happened frequently enough to include in their updated trading
system, and that they could be tested to ensure they weren’t
statistical flukes”. (pg 109)
“Simons and his colleagues hadn’t spent
too much time wondering why their growing collection of algorithms
predicted prices so presciently. They were scientists and
mathematicians, not analysts or economists. If certain signals produced
results that were statistically significant, that was enough to include
them in the trading model” (pg 150).
“I don’t know why the planets orbit the sun. That doesn’t mean I can’t predict them” – Simons (pg 151).
“More than half of the trading signals Simons’s team was discovering were non-intuitive,
or those they couldn’t fully understand. Most quant firms ignore
signals if they can’t develop a reasonable hypothesis to explain them,
but Simons and his colleagues never liked spending too much time
searching for the causes of market phenomena. If their signals met
various measures of statistical strength, they were comfortable wagering
on them.” (pg 204).
“Volume divided by price change three days earlier, yes, we’d include that” – Simons (pg 204).
2. Everyone struggles with discipline and following their system. Even the Greatest of All Time (G.O.A.T)
Discipline is
key and the ability to consistently follow your system(s) can be the
difference between winning and losing. We all believe discipline becomes
easier if you have more reliable edges or have grown your account quite
a bit, but Jim Simons would probably argue that is simply not true!
BuildAlpha: In
Dec 2018, Simons (worth approx. $23B at the time) called his advisor
and wanted to override his systems (pg 308). The systems that have
created the most incredible track record in history.
In the “Quant
Quake” of 2007, Simons overrode his systems before the eventual rebound.
One employee was quoted as saying it cost the firm money (pg 260).
Moral of the story.. follow your system and trust your research!
Everyone struggles with this, but we must.
Note: Majority
of his career Simons was actually the one advocating to NOT override
the systems and may be a large part of his success. These were just two
small examples.
“Trust the model. We have to let it ride; we can’t panic” – Simons (pg 216
3. Surround yourself with a great team
This one
should be obvious, but no one becomes the G.O.A.T alone. Brady has
Belichick, Jordan had Pippen, Kobe had Shaq, Ruth had Gehrig, etc.
A large
portion of the book chronicles how Jim sought out help from brilliant
individuals, hiring them away from prestigious positions (science, tech
and academia) by offering to double their salary. I won’t go over every
individual, but a lot of chapters in this book are dedicated to the
spectacular individuals that helped create the incredible returns which
give Jim Simons the G.O.A.T title.
He recruited
great talent to his team. Surround yourself with those that are experts
in things you are not or inspire you to push past your limits.
Incorporate
different approaches to your own similar to how Simons did. Trading is a
lonely business at times.. you don’t need a hedge fund to build your
own team.
4. Build strategies using different data.
Sure price and volume are great but the book mentioned other areas of alternative data Renaissance found useful.
Here are some simple ideas the book mentioned:
– sentiment
– correlations and relative moves
– number of times a stock’s ticker appears in major publications (regardless of sentiment)
Additionally, here is a previous See It Market blog I did using Commitment of Traders report to generate a trading signal: https://www.seeitmarket.com/how-to-improve-market-returns-using-alternative-data-17806/
5. Edge doesn’t have to be big.
Renaissance
searched for “overlooked” edges and joked about a 50.75% win rate while
utilizing the law of large numbers to win in the long-run.
Often times we
get caught up searching for the holy grail or the perfect entry/exit
for our trading or strategy development. But even with all these PhDs,
RenTech was excelling trading a nearly 50% winning system to generate
such astronomical returns. Much more can be gained by combining and
adding unique smaller edges together than wasting time hunting for the
perfect holy grail strategy!
“We’re right
50.75 percent of the time… but we’re 100 percent right 50.75 percent of
the time. You can make billions that way” (pg 272)
Bonus:
Build Alpha:
Money isn’t the be all end all. He’s had tremendous tragedy in his
personal life. Remember to enjoy LIFE while on the financial quest we
are all on! The market isn’t going anywhere.I enjoyed the book and hope
you do/did as well.
Sunday, 17 November 2019
Tracking Sigma Scores Of Price Changes For Regime Shiftsh
Measuring price moves is the name of the game.
However, measuring price moves given recent context can add additional benefits to your trading performance.
Build Alpha:
At times, the market can get very quiet which can make a 1% price drop
feel like a 10% price drop (think summer trading). At other times, a 10%
price drop can feel like a 1% price drop (think 2008). This is a
driving force in why I often prefer to view price moves in standardized
form and expressed as “sigma” moves. A sigma score basically tells you
how many standard deviations can fit between the mean and the current
price move. To calculate sigma you simply subtract the mean from the
underlying value and then divide that difference by the standard
deviation.
Sigma = (X – Mean) / Stdev
In our case we will have X = the natural log of the one bar price change or log(close[t] / close[t-1])
The astute
reader would question the lookback period used to calculate the mean and
standard deviation of X used in our sigma calculation, and that brings
us to a very unique indicator I often view.
I personally
like to track the rolling window of one month (22 trading days) and one
year (252 trading days). I then like to compare the one month sigma
score of price changes to the one year sigma score of price changes.
This gives an indication of how current volatility compares to more
long-term volatility.
Below is a
plot of the sigma score calculated on a rolling monthly basis and on a
rolling yearly basis. You can see the monthly sigma scores stay
“bounded” between -4 and +4 whereas the yearly sigma scores vary a tad
more.

All of this is great, but how can we use this and why am I telling you about this…
Build Alpha: Well
when the monthly sigma minus the yearly sigma difference becomes
greater than 1.5 we start to identify some key trading periods or
moments in the S&P 500. For example, the instances where the
difference between the monthly and yearly sigma reach 1.5 or more
include the peak in 2007, the bottom in 2008, the flash crash in 2010,
the European Debt Crisis of 2011, and the ETF meltdown of 2015.
Yesterday, May
17, was a significant down move but we are not near “significant”
moments in history (yet) as the yearly sigma score stays subdued. This
is definitely something to keep an eye on if this volatility persists
throughout the summer.
Over at Build Alpha,
I produce software that automatically creates systematic trading and
investing strategies, allows the validation and testing of each
strategy, and generates exportable and executable code for each strategy
– no programming necessary.
Sunday, 10 November 2019
Providing efficiency in Trading
Trading is a phenomenon which is not a
cake walk. One cannot become an expert in this field unless one has
gained some experience and knowledge in it. You need to seek guidance in
the initial stages of trading. For taking help you can either reach out
to some expert in this field or find advanced trading software that
comes with training. As the trading in securities markets is based on
interpretation of the market forces which in a lot of sense depends upon
the market forces so the human interpretation can lack at times in
analyzing certain aspects of it.
This is where software like Build Alpha
comes into play and can help regulate your operation. This is a
software which helps us in making strategies, testing our ideas, and
building our confidence to run automated strategies in real-time. This
is one of the best trading softwares to date and serves the needs of
traders. Anticipating the trend or mean reversion becomes much easier if
you do it through build alpha software solution. The best part… no
programming is needed!

Trading software is a computer program
designed to help traders and investors to trade and analyze stocks,
commodities, futures and various currencies in forex market. It also
gives you access to the latest news that affects the price movements of
stocks and their trends. There are different types of trading softwares
for both beginners and experts. BuildAlpha
is one such software which is helping the traders to achieve the
success in trading regardless of their skill level. It allows you to
stress test each and every strategy.
View in and out of sample test results
with ease, has data included, and generates actionable trading code all
from one command center. There are fund managers who study short and
long term charts with the help of these softwares. There are softwares
available to know technical and fundamental aspects of the stocks. Many
stock brokers provide softwares to their clients to trade on their own.
The main features of the software are order placement and proper
analysis of stocks. These softwares are built by third party and
licensed to online brokers.
The software gets new updates every week
which makes it more unique and worthy than other softwares which are
alike in the trading market. The new peculiarities that are coming out
every now and then are amazing it seems like trading has become easy
with the aid of this software. You will experience the difference after
using the Build Alpha
software. You will become a person who will start analyzing what is
important. Get efficiency in trading markets with the expert analyst
feature of this software, which helps you in analyzing trends more
specifically.
Originally Posted: http://buildalpha.us/build-alpha-providing-efficiency-in-trading/
Monday, 7 October 2019
What to Look for in Automated Trading Software
What does it
feel if you could take the psychological element out of the trading?
What if you could trade without becoming a victim of your own emotions?
Yes, this is possible! Automated trading software like Build Alpha makes this possible.
The machines
have given traders the power to automate their moves and take all the
emotions out of the deal. By utilizing trading software, individuals can
set parameters for potential trades, assign funds and open or close
positions all while sleep or watching TV. But using automated trading
software doesn’t mean continuous benefits. There are also some risks
involved even when the machine does all the work for you. Let’s find out
more about automated trading software and what to look at while
thinking to utilize automated software:

What is automated trading software?
Automated
trading software is a trading platform that uses computer algorithms to
scrutinize markets for certain conditions. The traders can set some
guidelines for equities, futures, forex, cryptos and more and can also
set entry and exit points for their prospective positions and then the
computer will do the rest. That is, find the optimal entry and exit for
any set of assets.
Build Alpha
– the automated trading software then monitors the symbols and tickers
that fit the criteria and perform trades based on the pre-established
and tested parameters. The benefits of automated trading can be
noticeable. People are limited in the number of stocks and tickers they
can monitor at any given moment as all of us have only two eyes.
But the
machine can look through diverse markets and securities at a pace that
is not understandable to flesh-and-blood traders. Algorithms can catch a
trend reversal and perform a new trade-in a fraction of seconds all
while monitoring existing positions, looking for new ones and testing
historical patterns.
What to look for in automated trading software?
All the automated trading software shares a
few common characteristics. Here are some features that you need to
keep in mind as you choose one. Let’s find out:
- Access to preferred markets – Using automated trading software doesn’t mean traders will have access to all the markets. This means the software is used to trade particular products or markets. Hence, ensure that you can trade your preferred securities.
- Detailed price history for backtesting – Charts are decisive to execute backtests, so make sure that your automated trading software has thorough backtesting that can be used across numerous timeframes, symbols and asset classes.
- Functional interface – The computers can do much of the profound lifting but automated platforms require to be managed. Hence, pick up the software with a changeable interface so you can make changes on the fly. Make sure you can test what you want easily!
Wrapping Up:
I hope the article has helped you know more about automated trading software. The automated trading software BuildAlpha can
simplify life in a number of ways. You can create hundreds of trading
strategies at click of a button. This software lets traders and money
managers the capability to make hundreds of trading strategies all with
no programming neceassary.


